This post will highlight that strong public oversight and in-house expertise are essential requirements for the infrastructure bid process, construction, and contract management. This goes against the conventional wisdom that infrastructure projects are best managed when done primarily by relying on expertise drawn from outsourced project management consultants and with limited public management.
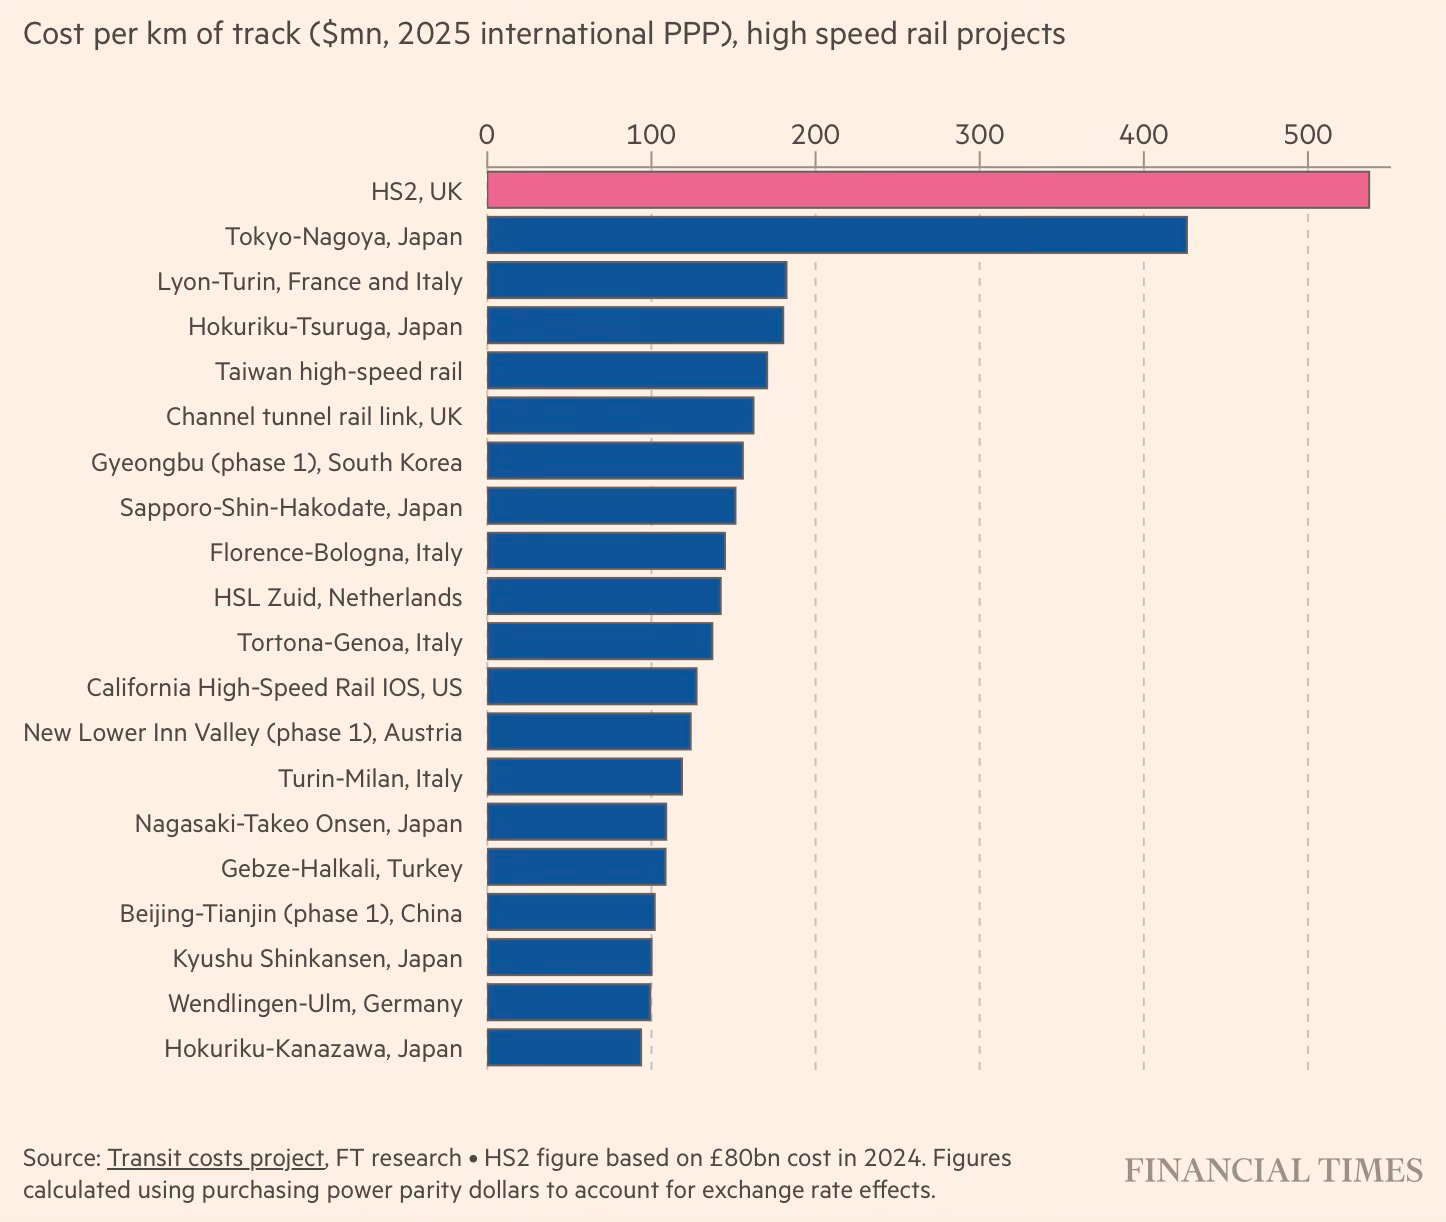
As an illustration, FT has a long read on how the much-awaited 225 km London-Birmingham High Speed (HS2) railway link, which was started in 2019 and is projected to be completed by 2035 at a total cost of £80bn (2024 estimates). At $537mn per km, it is easily the most expensive project in the Transit Costs Project research group’s dataset of 94 railway projects. Taxpayers are already paying about £7bn a year, or £140mn a week, for HS2, which is being built at barely half the length originally envisaged.
The FT article points to possible reasons for the cost increases.
HS2, a taxpayer-funded body, was set up in 2009 to deliver the scheme, but contractors, who had lobbied for the railway, were embedded as project managers in the organisation’s offices at Canary Wharf. The Department for Transport as the sponsoring department was expected to provide oversight. Network Rail, which runs the country’s rail infrastructure, was sidelined but should have played a larger role, according to a government-commissioned report into HS2 in 2025... That left too much power in the hands of contractors and government officials without technical expertise.
In Japan, by contrast, the project management for new railway construction projects, including the Shinkansen high-speed lines, is handled by the Japan Railway Construction, Transport and Technology Agency (JRTT), a public body with technical capabilities. JRTT plans and determines the route, equipment and project costs and secures funding. It also carries out technical reviews once construction has started and adjusts the budget when there are design issues such as changes in groundwater and geology, which are common in large civil engineering projects…
At HS2, however, contractors signed off huge contracts on a “cost-plus” basis, where companies are paid a percentage of the total value of the work. This gave contractors an incentive to go over budget and “get more money as more money is spent”, the Stewart report found. In Japan, construction work is also outsourced, but bids that were too low were excluded to ensure the quality of the works, said Kanayama. The JRTT monitors the construction as it proceeds.
Closer to home in India, it has become a norm, especially (but not only) in state government projects, of project execution through teams with limited in-house expertise. The SPVs administering PPP concessions, and their respective infrastructure and industries departments in both central and state governments, have limited internal technical capabilities.
Governments have become increasingly reliant on outsourced project management consultants to undertake feasibility studies and make detailed project reports, manage the bid process, finalise tenders, evaluate execution quality, manage contracts, and decide on emerging contractual issues (including renegotiations). These decisions often conform only to the form of due-diligence without the rigour and practical expertise that only in-house experience and associated expertise can bring.
The exceptions in this regard are projects executed by the Indian Railways and the Department of Defence, which continue to rely primarily on in-house expertise on these activities. In contrast, the state government Public Works Departments (PWDs) are generally kept out of the conceptualisation, tendering, execution, and O&M of large infrastructure projects executed by many state governments through their infrastructure and industry ministries.
While the PWDs are generally known for their failings, deficient expertise, and pervasive corruption, they also have competent officials with expertise and commitment whose services are often overlooked. In any case, the solution to the deficiency of capabilities in these entities is not to outsource critical project activities but to build up these capabilities internally.
The article also points to another common reason for cost overruns in large infrastructure projects.
Very large rail schemes in Britain are typically authorised through their own bespoke parliamentary bills. That reduces the risk of subsequent legal challenge, which HS2 has indeed survived, but also limits the ability to make changes later, something that with a scheme this immature was to prove disastrous. The scope locked in through this process is now widely seen as excessive: the fastest conventional-tracked railway in the western world, with a speed of 400kph, one-third above the European high-speed standard even though distances between English cities are short. A faster line needs to be flatter and straighter, with more earthworks, tunnels and viaducts, and higher-quality track and structures, all of which cost more.
This is perhaps unavoidable in the case of massive multi-generational public-financed projects, even desirable to get the bipartisan consensus that’s essential for the sustenance of such long-drawn projects.